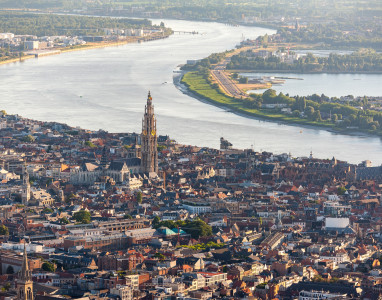
We offer affordable spaces

In a few months, Blue Gate Antwerp will welcome its first occupants. The brand new, eco-effective and water-bound redeveloped brownfield is exemplary for the ambitions of the city in catering for modern industries. Here, sustainable production facilities and state-of-the-art R&D departments will find their natural home.

The recent growth of Antwerp has also created an immense array of available office spaces, ranging from old industrial buildings to new developments, both in the heart of the city or at its outer borders.
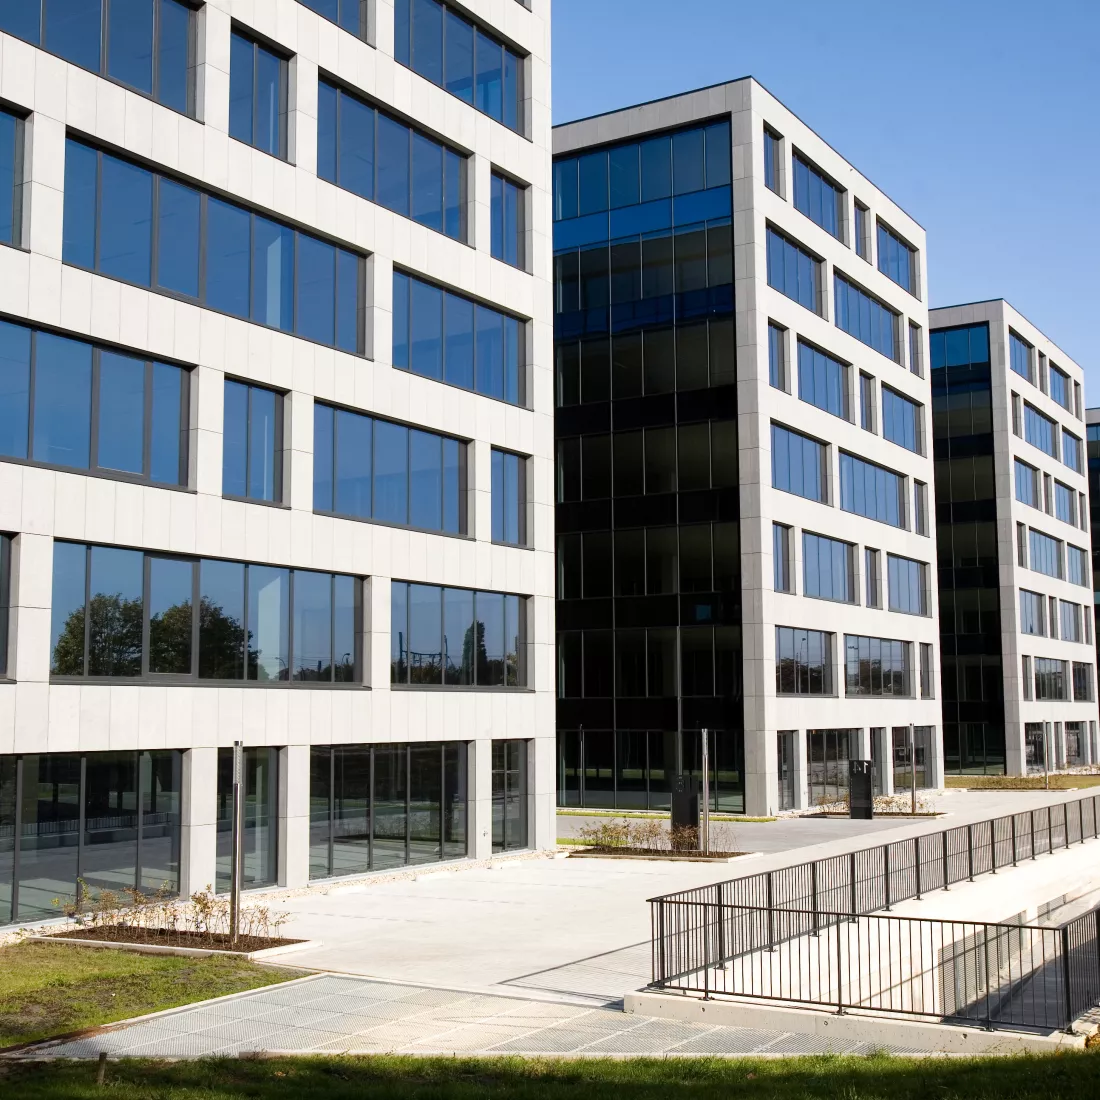
Plenty of office space
Copyright | Stad Antwerpen I Wim Kempenaers

There are 2.2 million m2 of office space in the City of Antwerp, and so there are plenty of offices. The upper rental limits in the centre is 160 euros/m²/year.

Office space is cheaper in Antwerp than that of comparable quality in the major commercial centres in neighbouring countries.

Office rental prices

Office rental prices

Prime rents for office space 
City Prime Rents
London (West End) GBP/sq.m/yr 1097
London (City) GBP/sq.m/yr 700
Paris (CBD) €/sq.m/yr 900
Paris (La Défense) €/sq.m/yr 525
Frankfurt (CBD) €/sq.m/yr 540
Munich (CBD) €/sq.m/yr 474
Amsterdam (South Axis) €/sq.m/yr 450
Dusseldorf (CBD) €/sq.m/yr 342
Brussels (EU Leopold) €/sq.m/yr 320
Lyon €/sq.m/yr 305
Marseille €/sq.m/yr 260
The Hague €/sq.m/yr 230
Hamburg (CBD) €/sq.m/yr 360
Rotterdam €/sq.m/yr 235
Antwerp €/sq.m/yr 165

Source: The DNA of Real Estate Europe, Fourth Quarter 2020, Cushman & Wakefield


Discover the available office hubs in Antwerp


Industrial space

There are 760 hectares of land in the City of Antwerp that are developed or have development potential for industry and logistics. Over 56 hectares of that is unused and unallocated. The upper rental limit for industry is 57 euros/m²/year, while for logistics the upper rental limit stands at 48 euros/m²/year.

Industrial space in Antwerp in 2014
Parameter Value
Total surface area 752.22 ha
Unused unspend 56.80 ha
Prime rent industry 43-48 EUR / m² / year
Prime rent logistics 46 EUR / m² / year

Source: Arcadis and Jones Lang Lasalle, 2014

Occupancy cost

Cushman & Wakefield splits up the industrial rents for Belgium and France into those for logistic locations and those for manufacturing locations. For the other countries, only industrial rents are given for the logistic locations and no further splitting is done. 


Industrial rents for logistic locations in EUR/m²/year in Q3 2017
City Occupancy cost
London (Heathrow) 160
Bristol 75
Birmingham 70
Edinburgh 65
Schiphol 92
Frankfurt 78
Düsseldorf 67.2
Rotterdam 75
The Hague 60
Antwerp 48

Source: Cushman & Wakefield, Industrial snapshot Q4 2020

Industrial rents for manufacturing locations in EUR/m²/year in Q3 2017
City Occupancy cost
Paris 125
Lyon 80
Strasbourg 80
Bordeaux 75
Marseille 70
Lille 70
Toulouse 65
Brussels 57,5
Antwerp 56
Ghent 44

Source: Cushman & Wakefield, Industrial snapshot Q3 2017 (11/2017)

Development areas
Blue Gate Antwerp

Blue Gate Antwerp is a brownfield of 103 hectares in the southwest of Antwerp that is being redeveloped into a high-quality waterfront and eco-effective business area. Blue Gate Antwerp offers space to innovative production companies, waterway-linked logistics companies and research and development, and is fully committed to the circular economy.

Blue Gate Antwerp wants to be CO2-neutral. The prevention or recycling of waste, the maximum and integral closing of material cycles, the use of renewable energy, the focus on green products… are all essential characteristics of the site. 

Churchill Industrial Zone

The site is ideal for the development of a large-scale circular economy project. Within the port area the site is one of the few large remaining areas in the centre of Antwerp's industrial cluster.

The Antwerp Port Authority is offering an attractive industrial investment opportunity in the heart of Europe's main integrated industrial, maritime and logistics platform. The site is an ideal base for high-tech waste treatment. The project area is immediately available.

Saeftinghe Development Area

Saeftinghe Development Area, the northern expansion of the port on the Left Bank, comprises an area of approx. 1070 ha which will be developed for maritime, industrial and logistics activities. The construction of a tidal container dock is also planned here.

Logistic Park Schijns

The port is developing areas on both the Left bank and the Right bank for specific logistics activities with multimodal access. The Spatial Structural Plan for Flanders has pencilled in the development of two logistics area: The Logistics Park Waasland (left bank) and the Logistics Park Schijns (right bank)).

Retail space

There are over a million square meters of retail space in the City of Antwerp (excluding the hospitality industry and services). Frictional vacancy amounts to some 85 000 m², which means that there is ready availability for new investors.

Three-quarters of the retail space is located in shopping areas.


The top rental prices for retail space are in the centre of Antwerp around the Meir and Schuttershofstraat-a triple A location- (1 850 euro/m² on average). Outside of the centre (Nationalestraat, Abdijstraat) the rental prices are much lower (300 euro/m² on average).

Prime rent prices "main streets" city of Antwerp in EUR/m²/year
Street Occupancy cost
Meir 1 550 - 1650
Schuttershofstraat 1350 - 1550
Huidevettersstraat 1 550 - 1750
Wilde Zee 1 000 - 1250
Kammenstraat 500 - 750
Nationalestraat 350 - 750
Abdijstraat 300

Source: Ceusters (2020)

Prime rents for retail

Prime rents for retail in EUR/m²/year in Q3 2017
City Occupancy cost
London (West End) 16 146
Paris 13 255
Berlin 3780
Munich 4 440
Frankfurt 3 780
Hamburg 3 720
Cologne 3 540
Dusseldorf 3 420
Amsterdam 3 000
Glasgow 2 607
Antwerp 1 950
Brussels 1 850
Lyon 1841
Edinburgh 1 808
Manchester 1 747
Rotterdam 1 600
Maastricht 1 600
Lille 1 326
The Hague 1 250

Source: Cushman & Wakefield, Retail snapshot Q3 2017 (11/2017)

Affordable housing market

Cost of living in Antwerp

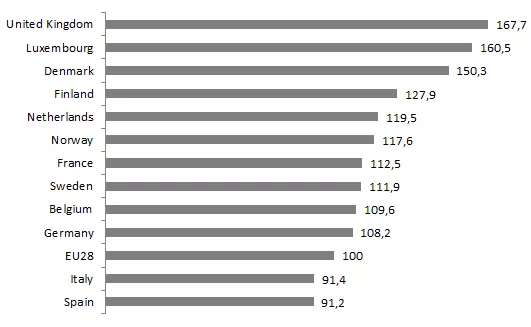
The cost of living in Belgium is lower than that of its neighbouring countries. The cost contains the average rent for housing as well as the cost for water, electricity and gas. The price comparison is shown with the average cost for the EU at 100. (source: Eurostat 2018)
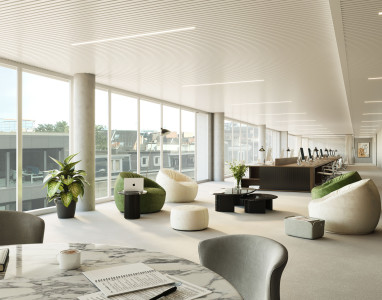
The 5 assets of Antwerp’s office market

The coronavirus struck a blow at the worldwide office market. Antwerp aims to recover rapidly. Its many assets attract international companies. This lively city at the heart of the European economy combines highly qualified personnel with affordable office space.